Gallery
Real screenshots from real scenarios - no staged demos. Click any image to view it full size.
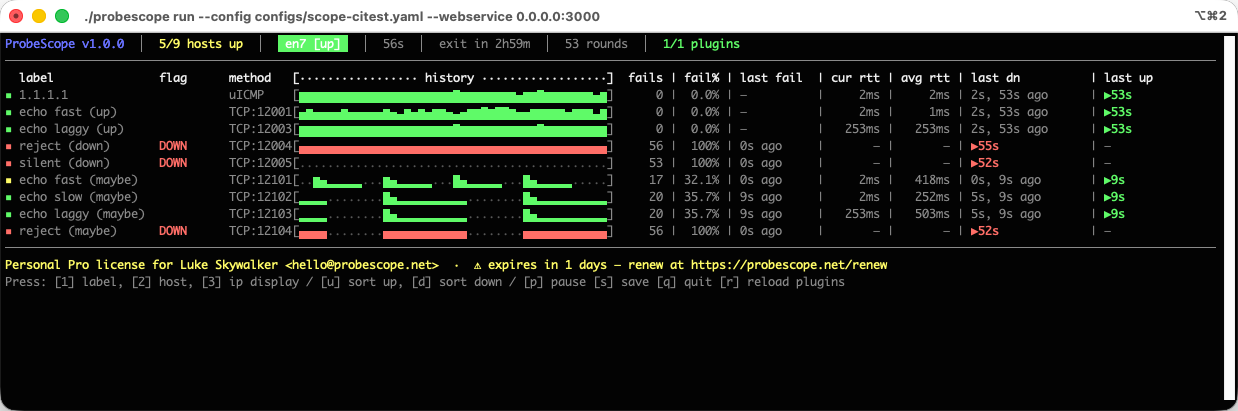
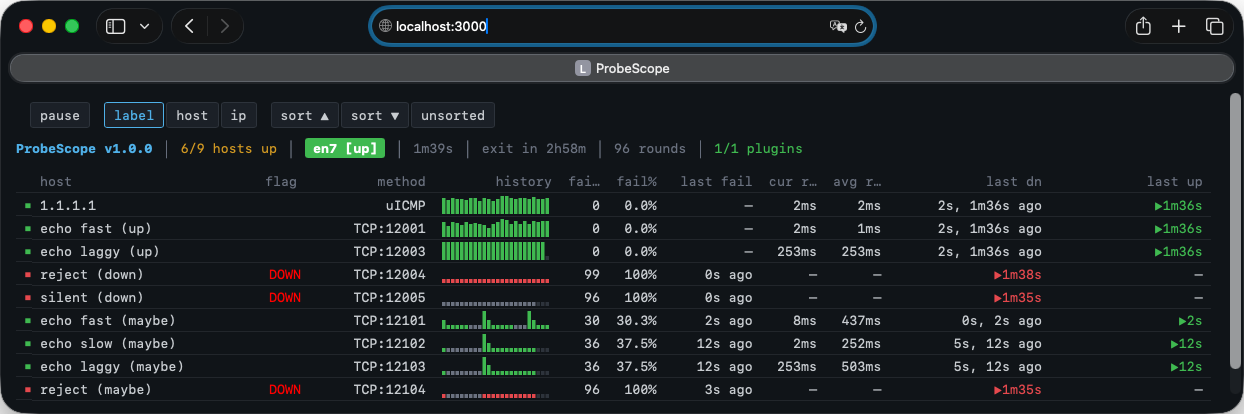
Synthetic hosts, real thresholds
A battery of fast, laggy, reject, and silent test targets — the same debounce threshold that keeps a real fleet's status trustworthy also keeps a CI/CD gate from flapping on a single dropped packet.
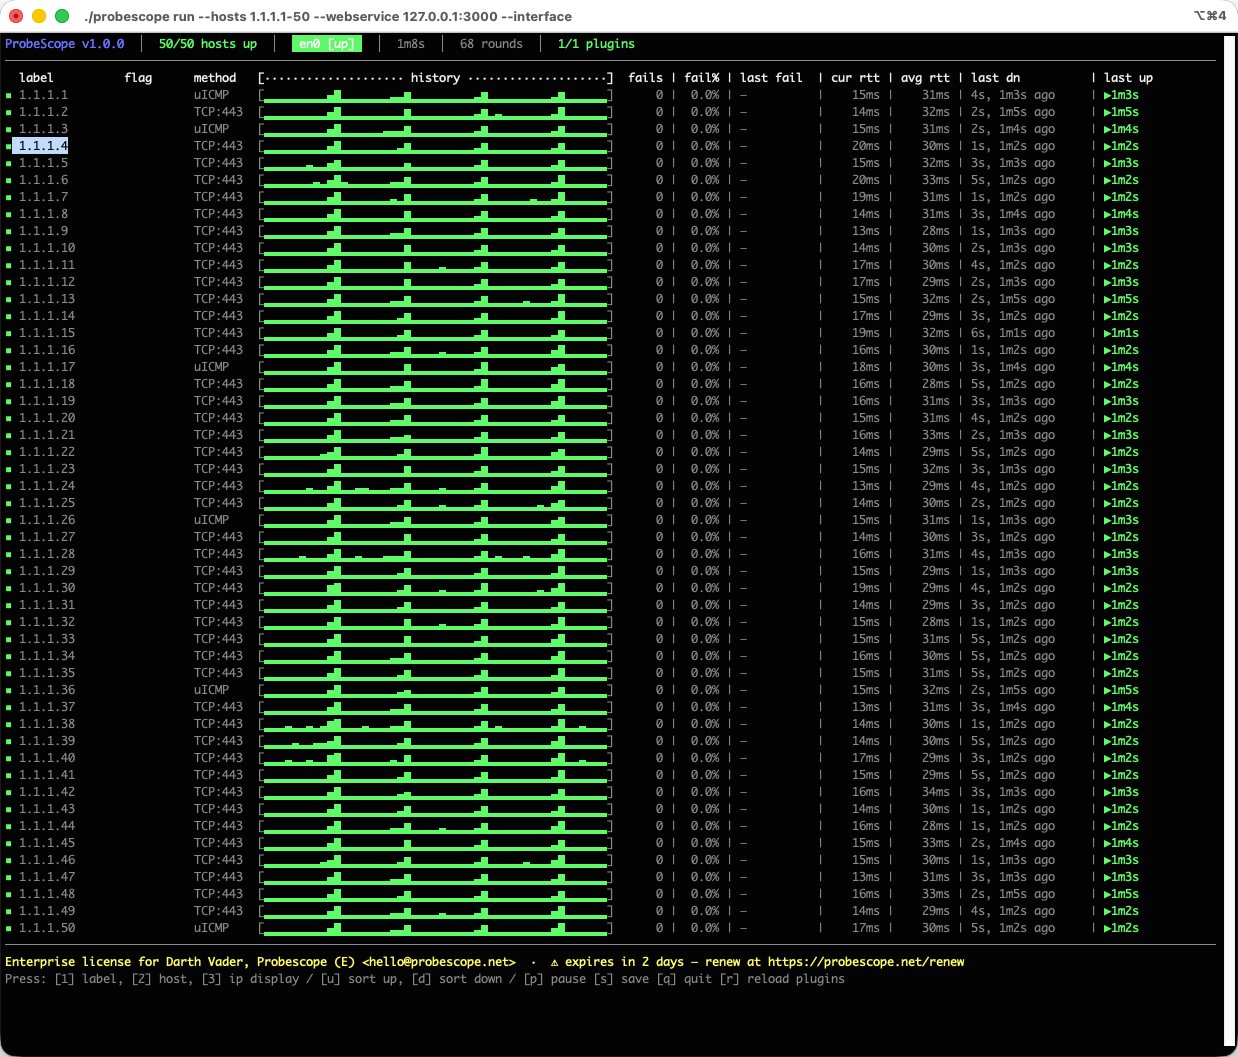
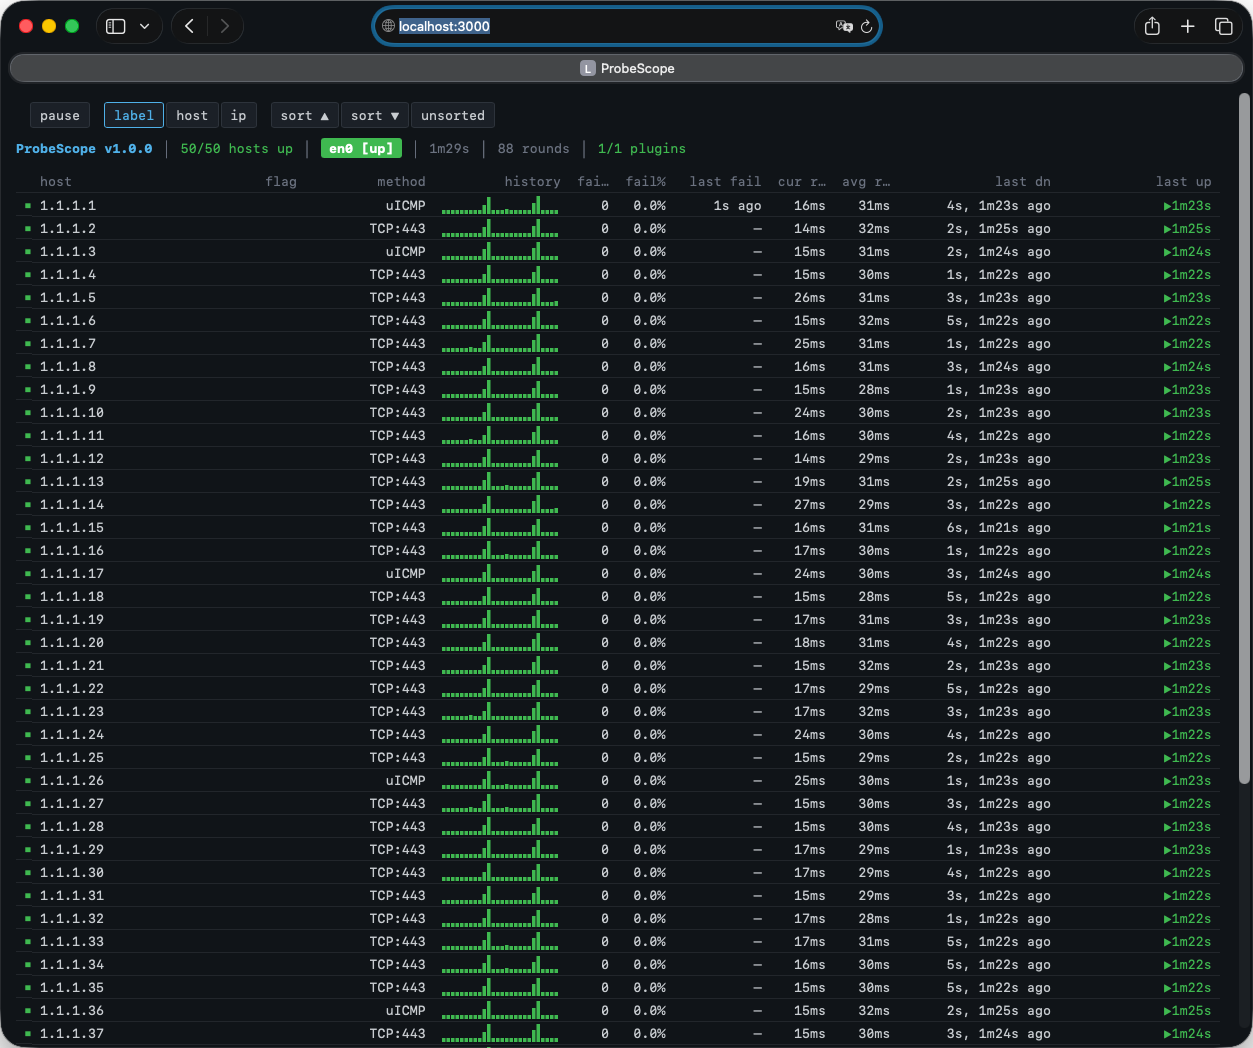
A public DNS range, watched end to end
Fifty hosts across a single subnet, ICMP and TCP mixed automatically per host — the same live table, whether you're watching it in the terminal or from a browser tab.
One flap, every row goes red — in the terminal
Twelve status pages, all healthy — until the local interface drops. The en0 [dn] badge and every row falling to DOWN at the same instant is the tell: it's your link, not twelve outages.
![ProbeScope terminal showing twelve status pages all up, en0 [up]](/screenshots/services-tui-up.png)
![ProbeScope terminal showing the same twelve status pages all DOWN at once, en0 [dn] badge in red](/screenshots/services-tui-int-down.png)
...and the exact same story, in a browser
No separate mobile view, no degraded fallback — the web console mirrors the terminal's data model exactly, badge and all.
![ProbeScope web console showing twelve status pages all up, en0 [up]](/screenshots/services-web-up.png)
![ProbeScope web console showing the same twelve status pages all down at once, en0 [dn] badge in red](/screenshots/services-web-int-down.png)
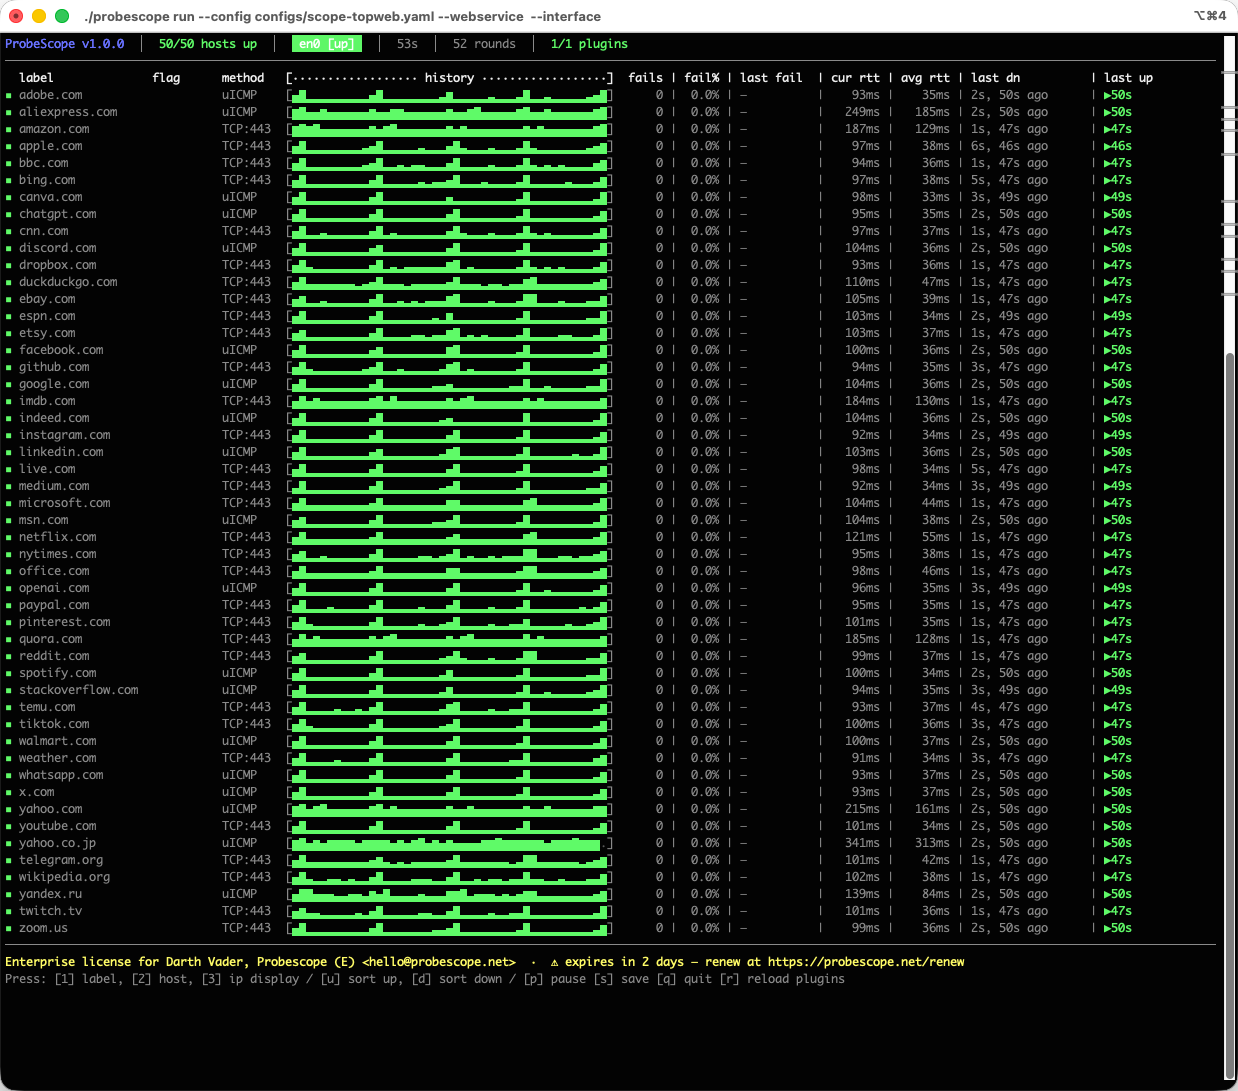
Fifty of the internet's biggest names, one screen
From adobe.com to zoom.us — ProbeScope doesn't care whether you're watching three hosts or the household names of the entire internet. Same auto-sizing table either way.
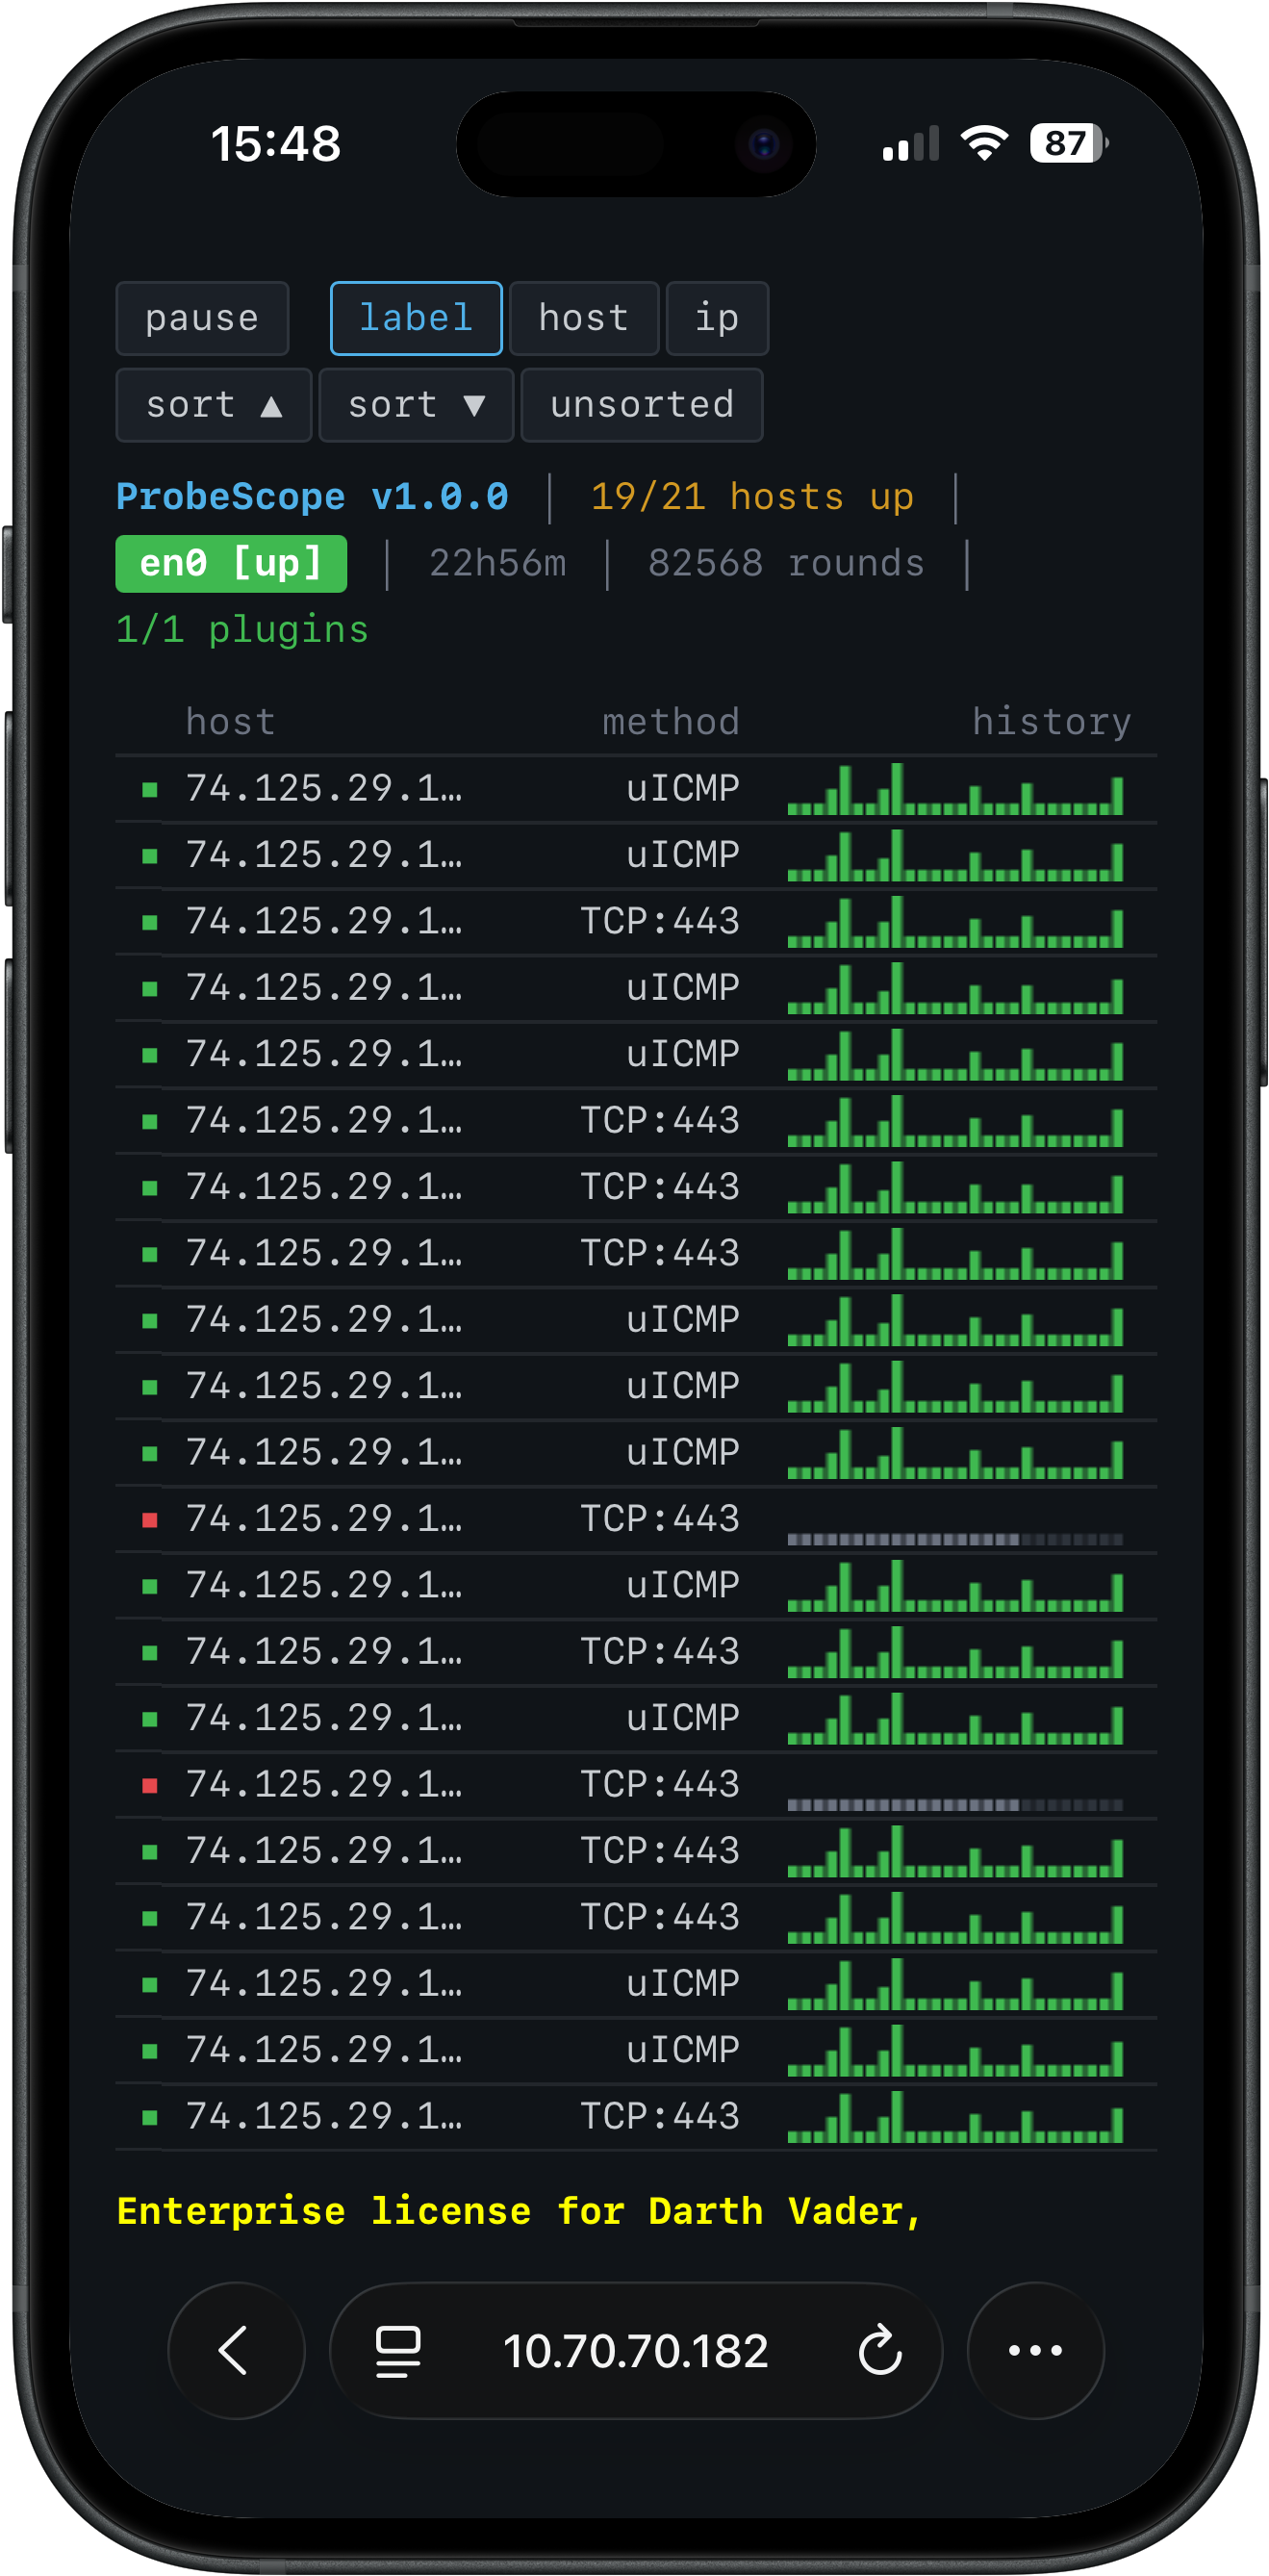
Monitoring in your pocket
The web console doesn't care what's rendering it. Turn on --webservice, connect over your Tailscale or WireGuard VPN, and check on your fleet from your phone in the checkout line, on the train, or from the other side of the world — no app to install, just a browser tab.