Tech Specs / Situational Awareness
See your fleet, beautifully — in the terminal or the browser
Monitoring shouldn't feel like reading a log file. ProbeScope gives you a live, at-a-glance view of every host's health, wherever you're looking.
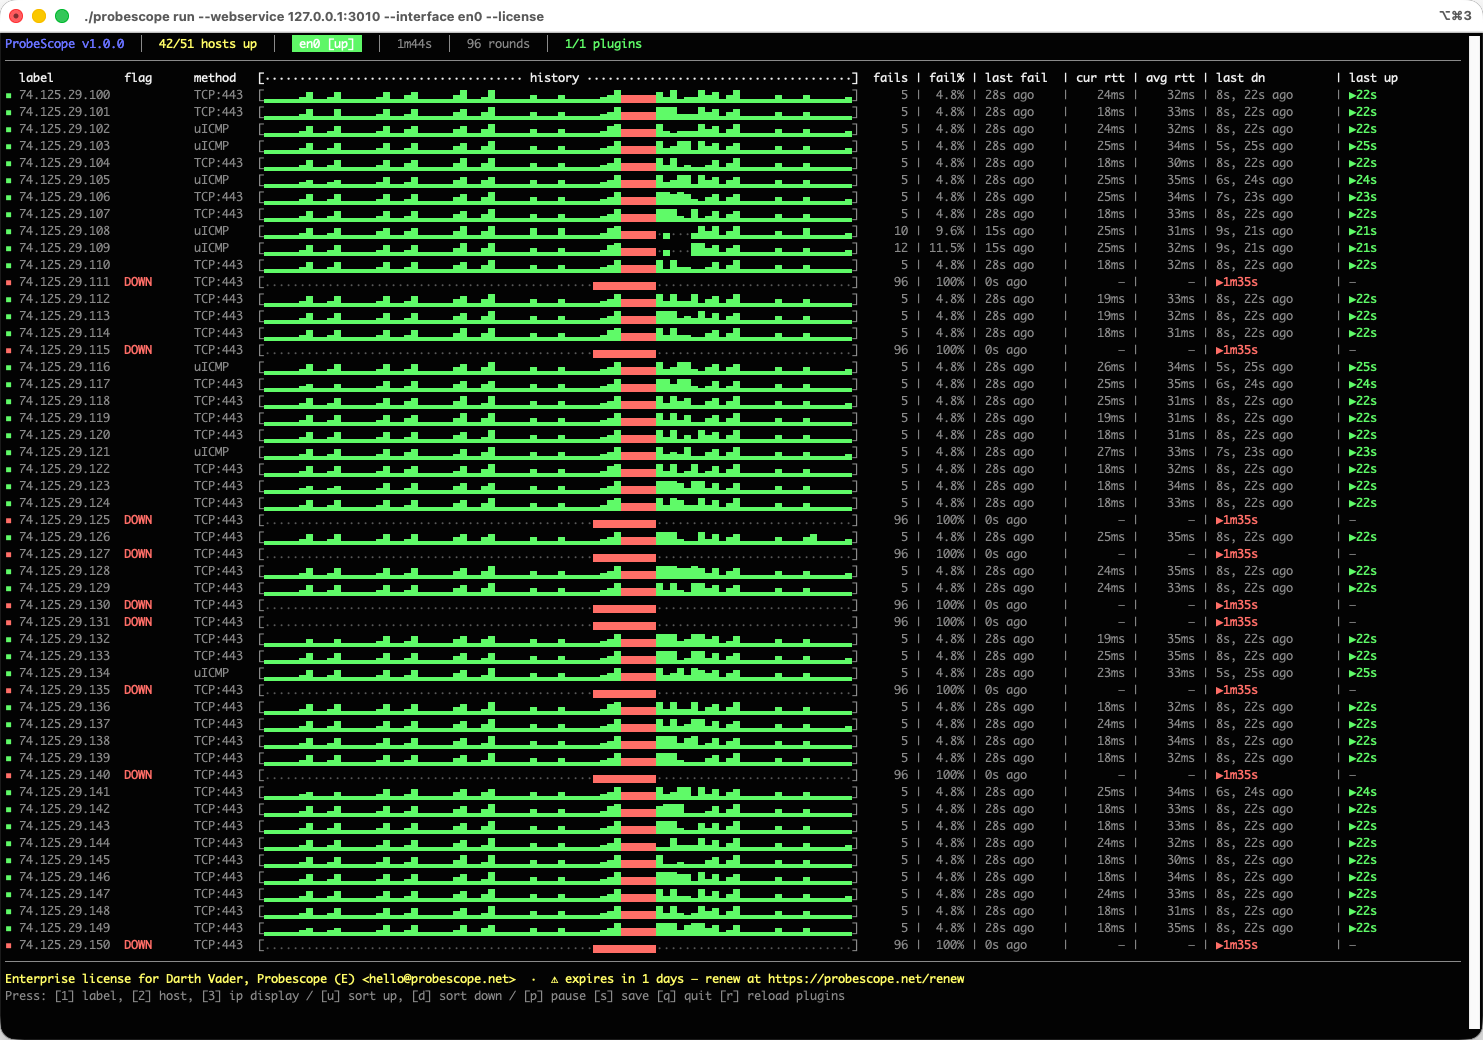
A terminal UI you'll actually enjoy
Sparklines, color-coded status, real-time RTT stats — all auto-sized to fit your terminal, whether you're watching 3 hosts or 300. No scrolling through log lines to figure out what's going on right now.
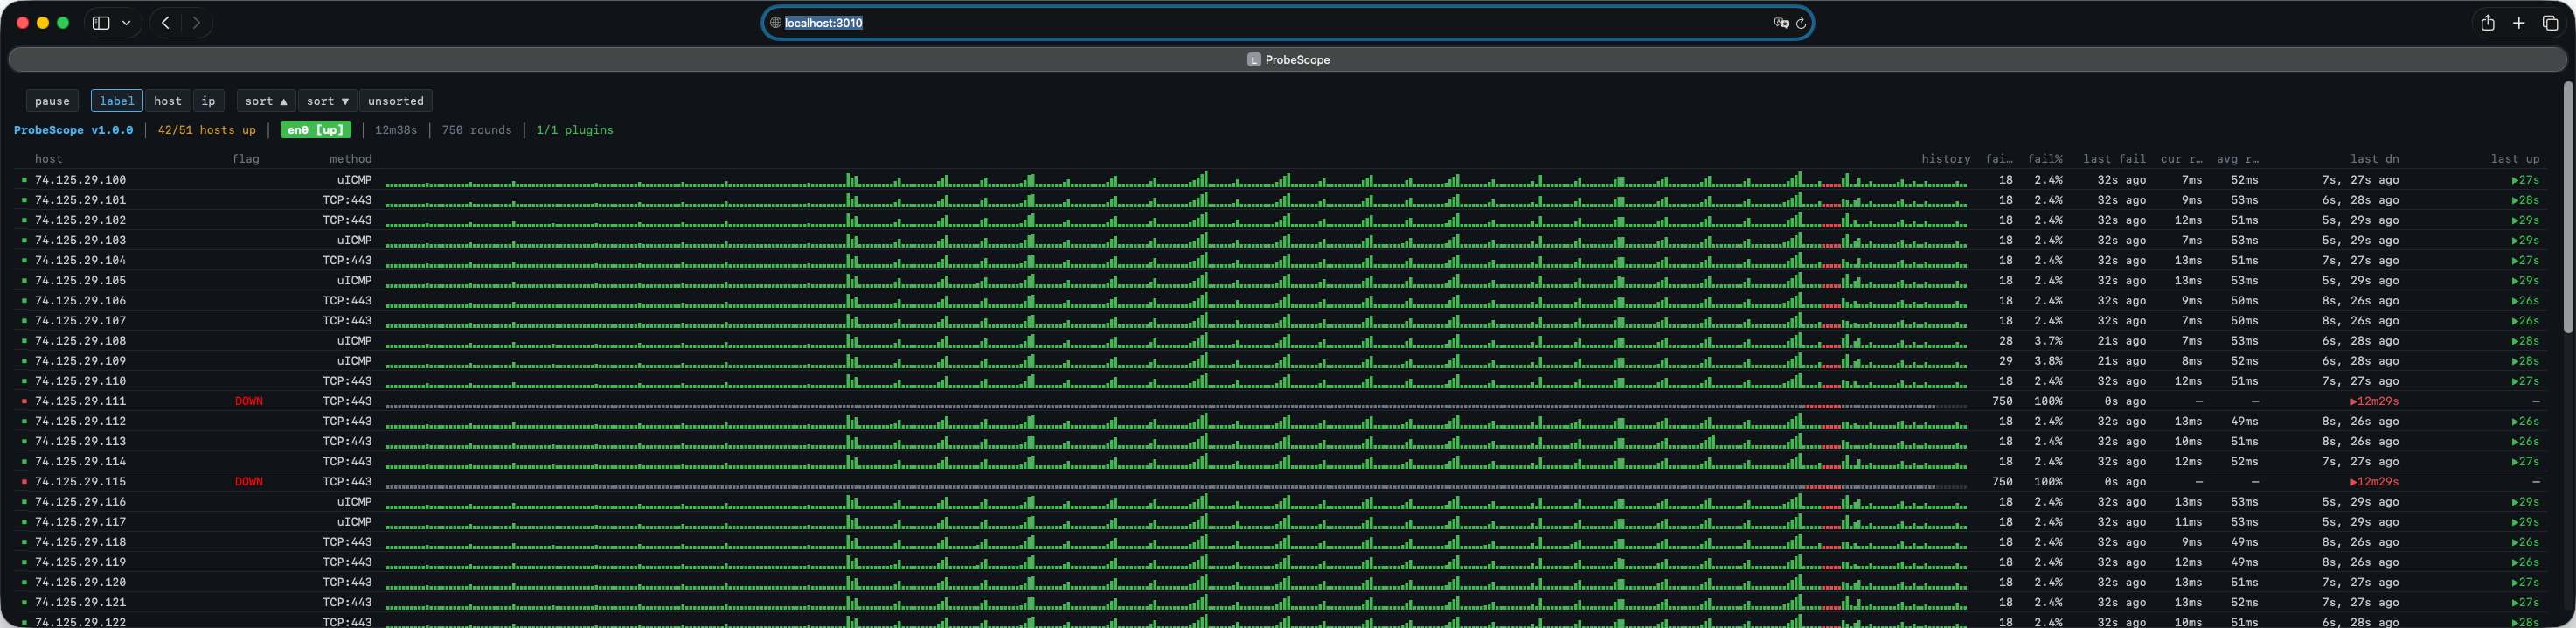
The same view, in any browser
Need to check on things from your phone, share a live view with a teammate, or embed it in a dashboard on the wall? Turn on the web console and get the exact same live data, streamed instantly to any browser — no separate app, no page refreshing.
Available to everyone
The web console isn't locked behind a paywall — every tier, including Free, gets it. Start simple and stay simple, or scale up to a full production fleet without switching tools.