Tech Specs / Situational Awareness
Situational awareness: terminal UI and web console
ProbeScope's fleet state — every host's up/down status, RTT, sparkline history, and flags — is rendered live in two surfaces that share the exact same underlying data model: the terminal UI (default) and an optional browser-based web console.
Terminal UI
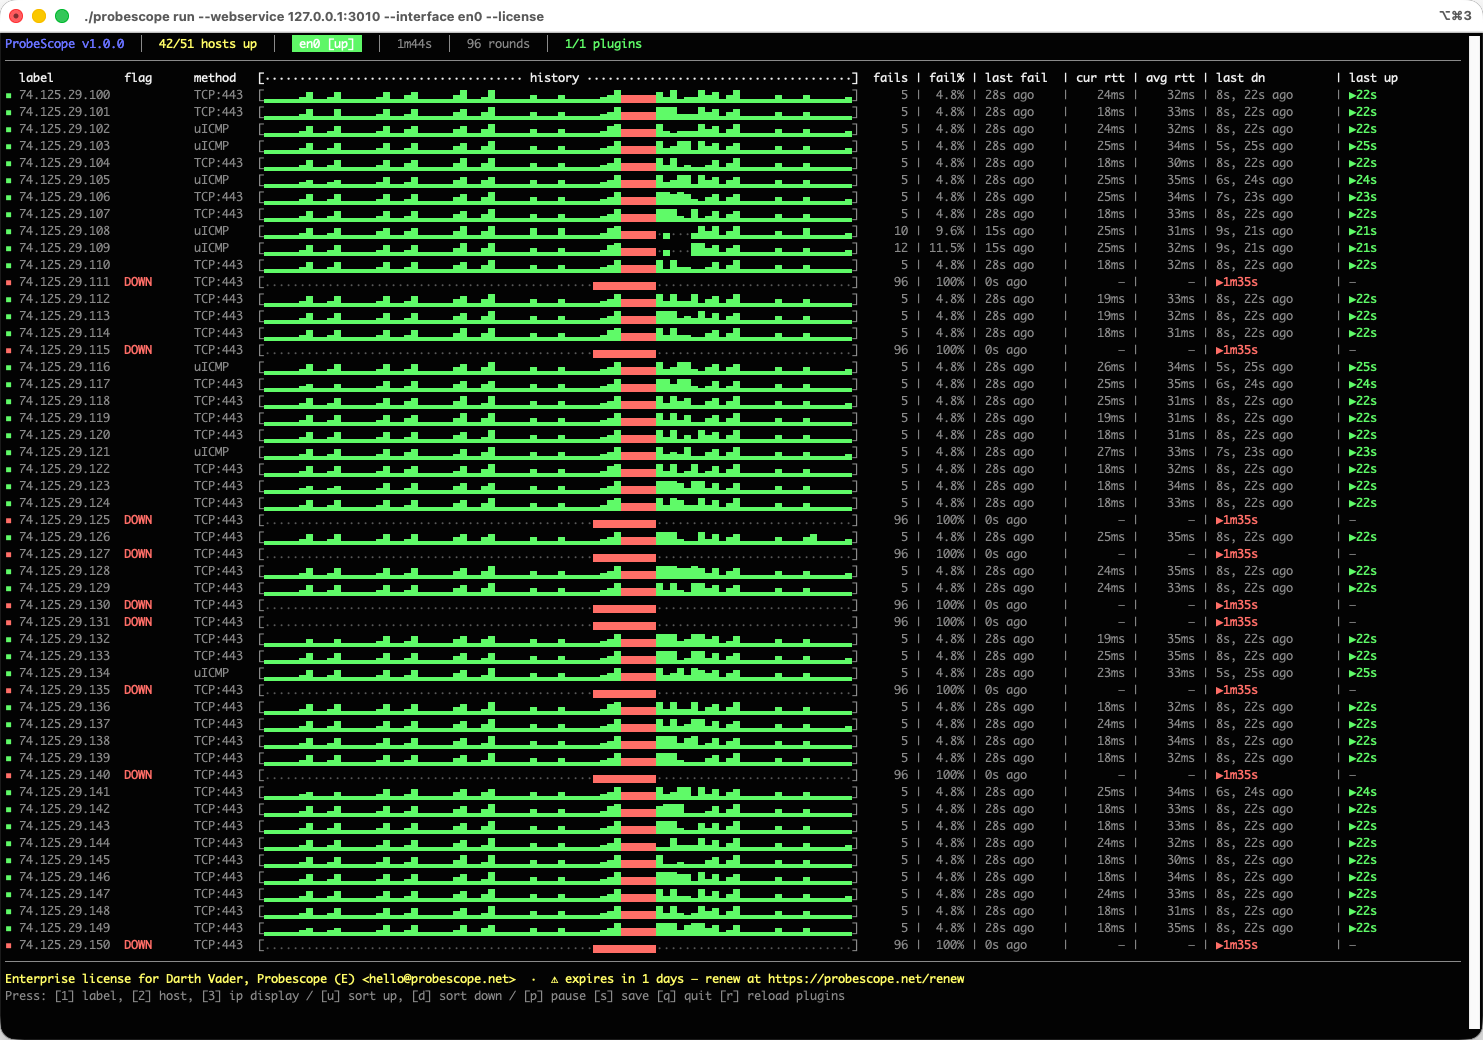
probescope run renders a live, auto-sizing table: one row per host, a sparkline of recent ping results, and a configurable set of stats columns (fail count, fail %, current/average/P95 RTT, last down/up period) that gracefully degrade as terminal width shrinks — the sparkline always keeps at least 10 characters, stats columns drop first.
- Host column display modes — keys
1/2/3switch between label, bare address, and resolved IP. - Sorting — keys
u/dsort ascending/descending by whatever's currently displayed. Re-sorting is relative to the fleet's current row order, not a reset. - Status marker — a one-character colored marker per host: green (confirmed up, last ping agreed), red (confirmed down, last ping agreed), yellow (last ping disagrees with the confirmed state — a transition in progress), dim (no ping completed yet).
- Title bar — hosts up/total, interface badge (
en0 [up]/en0 [dn]), elapsed time, remaining time (if--terminateis set), round count, and plugin load status. [s]saves current state to a YAML file (also directly reusable as a--configinput).[r]reloads plugins without restarting.
Repaints are batched (ping results are collected and rendered in one pass, not one repaint per ping), so terminal CPU/redraw overhead stays flat regardless of fleet size.
Web console
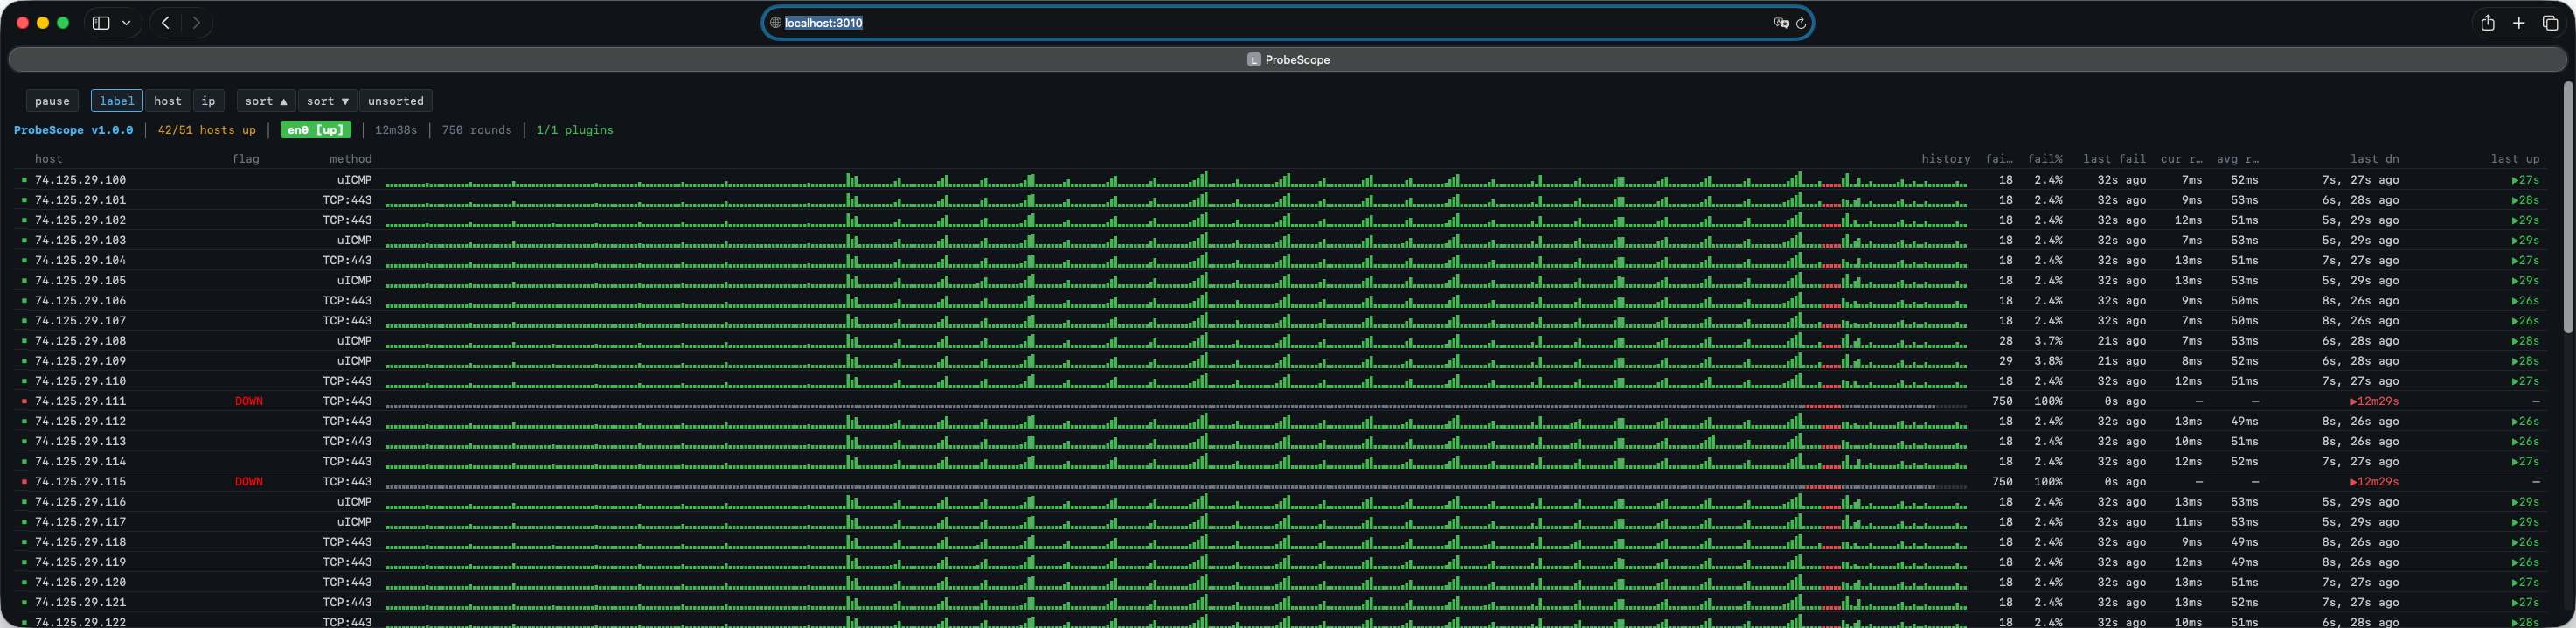
--webservice <ip>:<port> serves the same live state to any browser via Server-Sent Events — no page reloads, no polling. It works identically whether the underlying process is running the TUI (run) or headless (server), and for headless mode it is the interactive surface, since headless mode has no terminal UI at all.
probescope run --hosts 1.1.1.1,8.8.8.8 --webservice 0.0.0.0:8080- No TLS, no authentication — a deliberate v1 tradeoff, not an oversight. Put it behind a reverse proxy if you need either.
- Pause is the one write action exposed to the browser (a shared, global toggle — pressing pause in one browser tab, another tab, or the local terminal's
pkey all affect the same underlying state, since there's only one fleet to freeze). Quit, save, and reload-plugins remain terminal-only. - Display mode and sort order are per-browser, client-side-only preferences — one tab showing IPs sorted descending has no effect on any other tab or the local terminal.
- The sparkline is rebuilt client-side from a rolling per-host sample buffer, independent of the terminal's own width-derived buffer — so it always fills the browser window it's actually rendered in.
- If the underlying ProbeScope process restarts while a browser tab stays open (it auto-reconnects), the client detects the restart and resets its own state rather than mixing pre- and post-restart data.
Available on every license tier — no separate flag required beyond --webservice itself.
Related
- Integrations — server mode, where the web console becomes the primary interactive surface.
- Detection — the debounced state both surfaces render identically.